In web performance circles you’ll often hear about how the latency of a connection can be a bigger issue than bandwidth. The FCC broadband measurement report has a graph that illustrates this nicely:
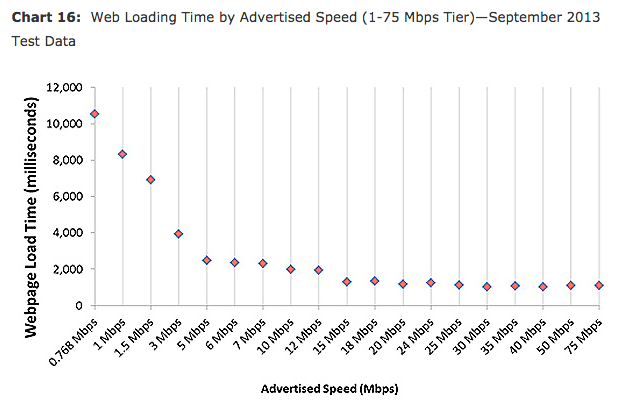
Once you hit 15 Mbps the bottleneck shifts towards latency.
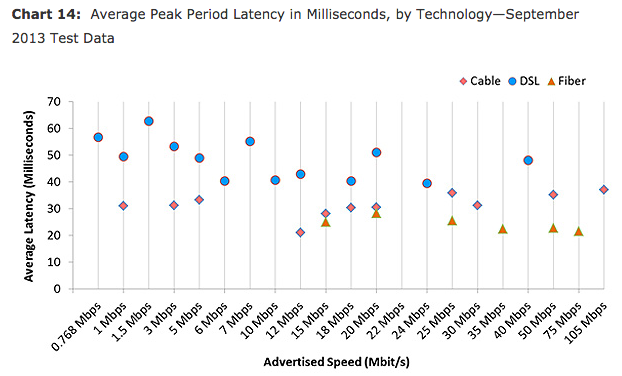
That led me to wonder what latency looked like for home connections in the US. Turns out the FCC has been collecting latency data as well ( emphasis is mine ):
In all our tests and results, latency is defined as the round-trip time from the consumer’s home to the closest speed measurement server within the provider’s network and back.
Across all terrestrial technologies during peak periods, latency averaged 34.9 ms.
…
Fiber-to-the-home services provided 24 ms round-trip latency on average, while cable-based services averaged 32 ms, and DSL-based services averaged 49 ms.
The highest average round-trip latency for an individual terrestrial service tier, i.e. excluding satellite, was 57.91 ms (Qwest/Centurylink), while the lowest average latency within a single service tier was 17.83 ms (Cablevision).
No surprise that fiber connections on average have a lower latency than cable or DSL:
The lower bound is in the 20 ms range, so that would be your best case scenario at this point.